Table of Contents
Tracing Options
Using the [Options] button in the panel, you can make various settings on individual tabs with regard to graphics overlays on 2D and 3D image windows.
Tab |Variables|
[Click on tab opens related wiki page]
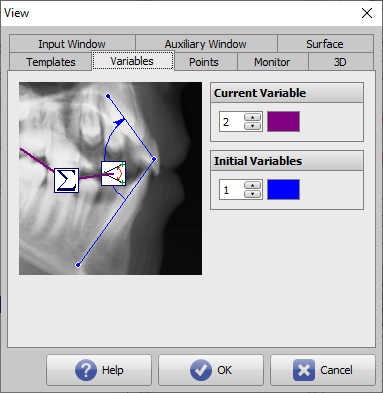
In the context menu above a calculated value in the Results table in module Digitize, the definition used to calculate the value can be illustrated graphically.

Panel Current Variable
The color and line width used for displaying the result variable can be specified here.
Panel Initial Variables
The color and line width used for displaying the initial variables can be specified here.